Dublin is leveling up. On current trends, the Greater Dublin Area will be home to about three million people by 2050. Cities that size tend to go one of two ways. Some keep a strong centre, fed by rail. Others scatter their jobs across office parks, and everyone drives between them. Unless we take deliberate steps now, Dublin is headed for the second, and without the motorways that make it work in America.
The thing I’m describing is polycentric sprawl: a city in which most journeys are between suburbs, rather than into the centre. In polycentric cities the jobs have scattered along the roads1. The opposite of polycentric is monocentric: where most journeys are between a suburb and the centre. Monocentric cities are like spokes on a wheel; polycentric ones are like a net.
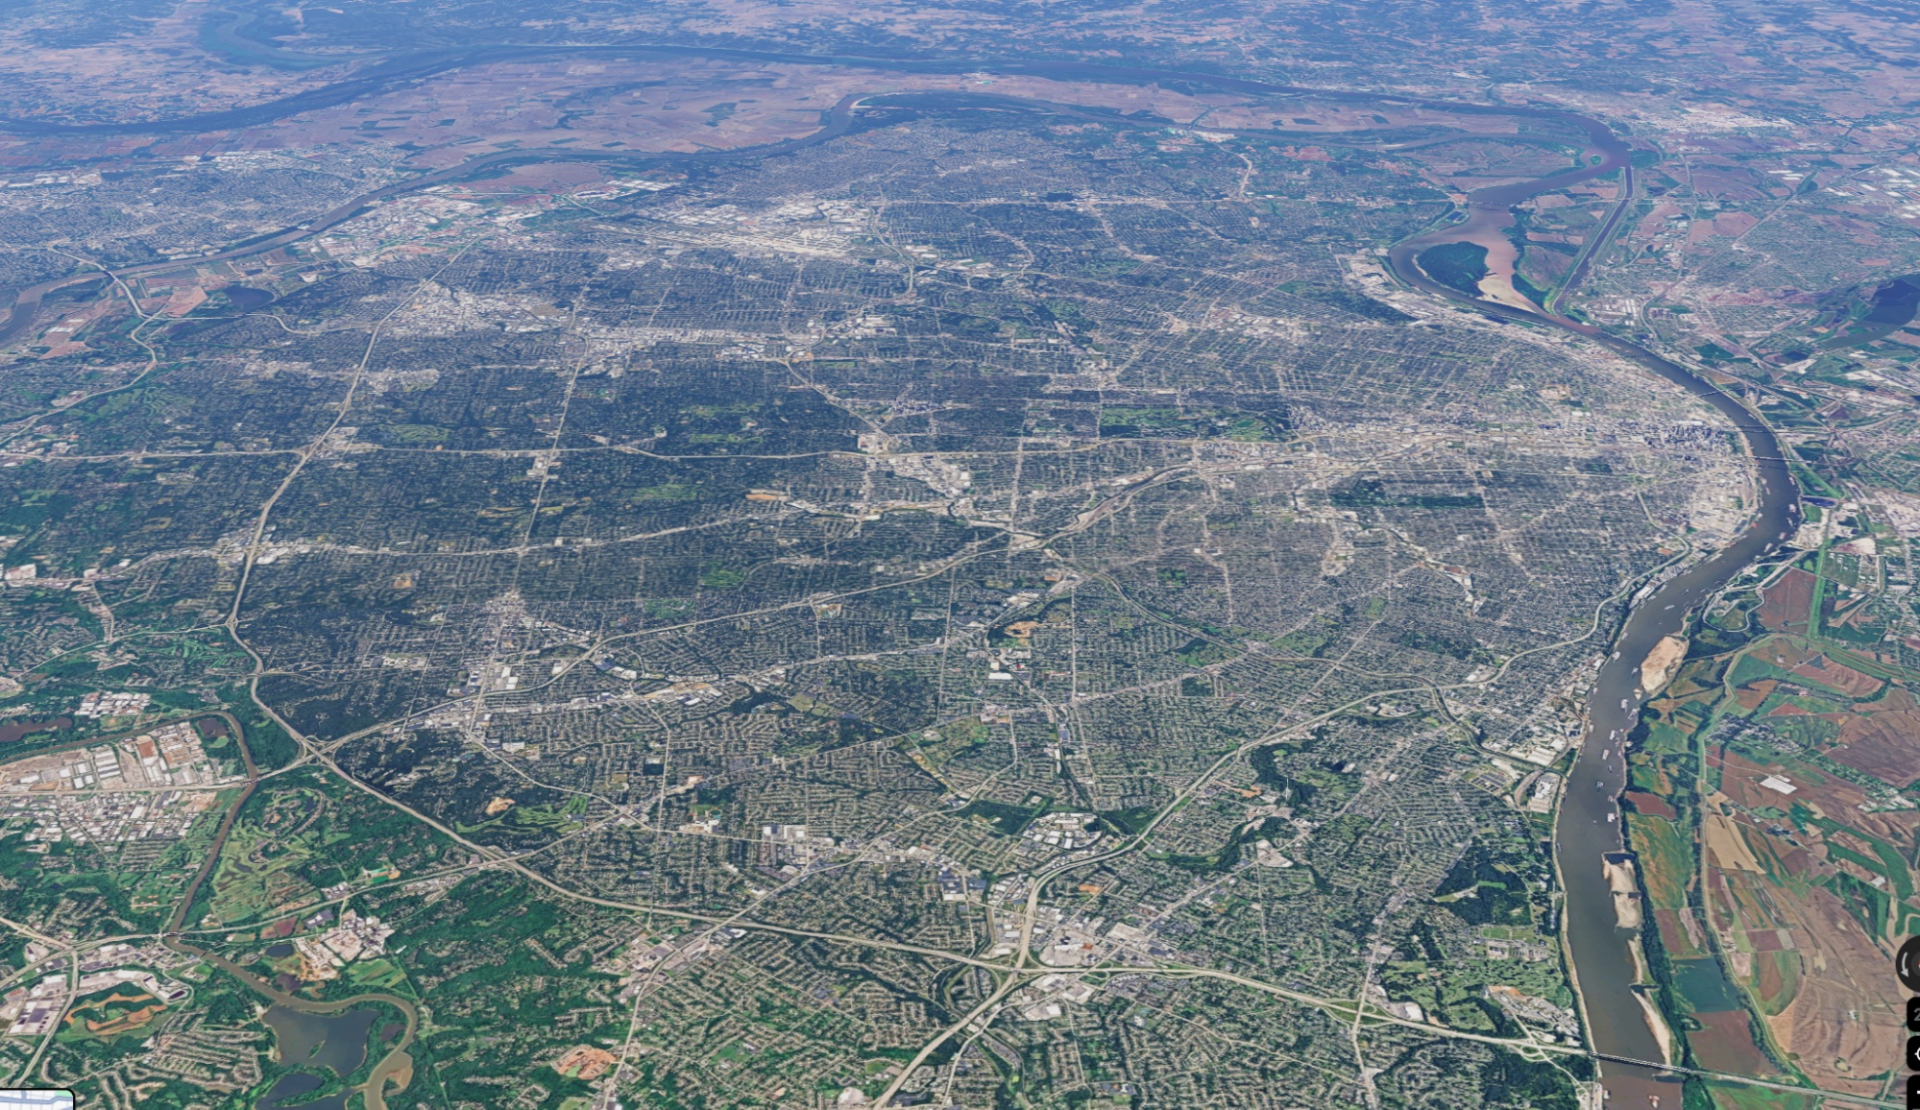
St Louis in the US is a polycentric city. 91 per cent of journeys there are between suburbs. You can see this from space: the green suburbs are seamed with grey industrial, retail and commercial clusters. People get around the city on highways.
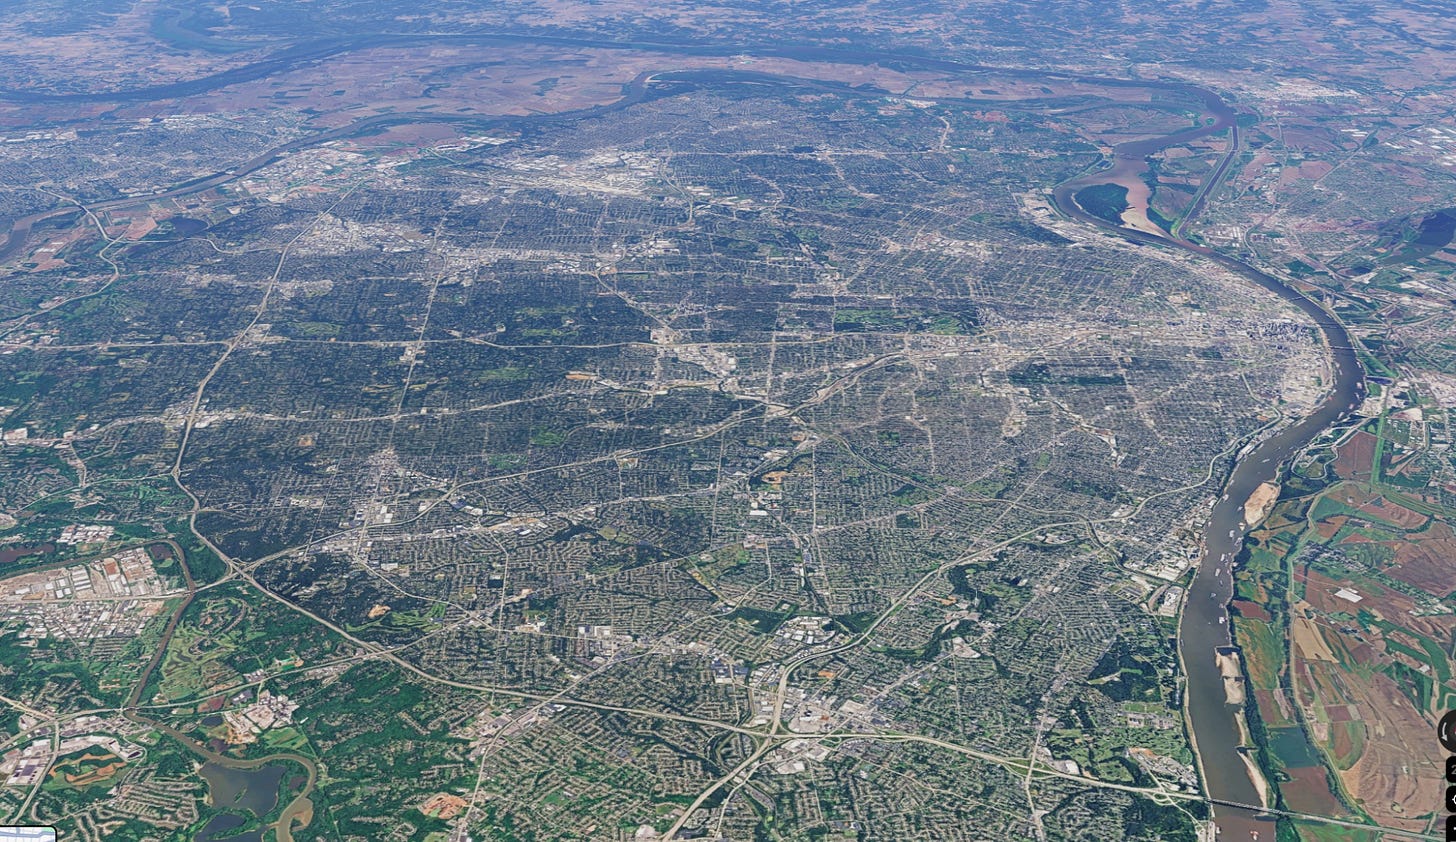
St Louis has a metro population of 2.5 million. You might think a city of suburbs, highways, and office parks would be a nightmare to get around. But it works pretty well because there is no shortage of roads. By my calculations on Google Maps, getting between two random places in the St Louis conurbation takes about 30 minutes without traffic and 50 minutes at rush hour.
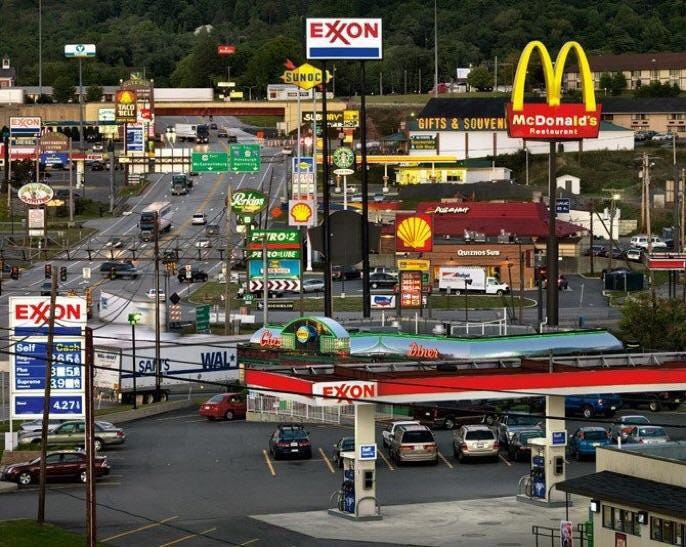
Dallas takes it up a level. About nine million people live there. Looking at the following aerial shot of Dallas/Fort Worth, it’s hard to make out which bit is the centre. It’s a broad web of grey commercial and industrial space, along the highways, with green suburbs filling in the gaps.
Surely at that scale you would think the whole thing would get congested and impossible. But no — my Google Maps methodology tells me random places in the Dallas conurbation are about 45 minutes away without traffic, an hour and ten with it. It wouldn’t be how I’d choose to live. But it makes sense on its own terms.

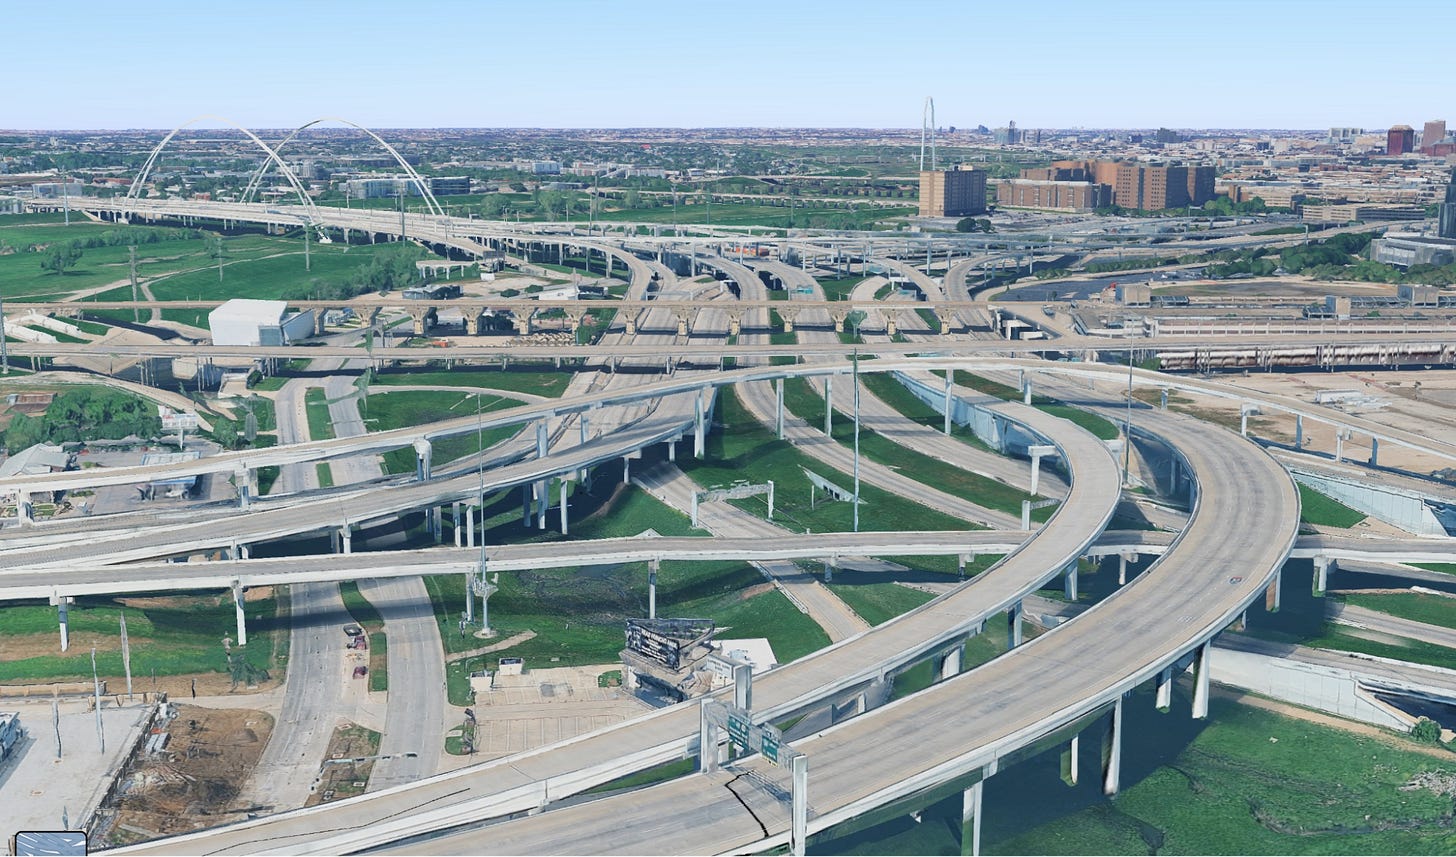
To do a Dallas on it, a city really must commit to the motor car. I count fifteen lanes of traffic at the thickest part of this junction in Dallas. And all those cars need parking spaces. Each multi-storey parking space costs about $20,000-30,000. Surface parking costs about $5,000. Dublin hasn’t committed to the car like that, and isn’t going to: nobody is proposing to bulldoze the Liberties for a fifteen-lane interchange. The worst-case scenario for Dublin is to be a poor man’s Dallas.
I can see how American cities came to have this shape. This shape is the path of least resistance. People wish to move to the suburbs for space, so roads are built to the suburbs. But as a pure matter of geometry, it’s difficult to move everyone in and out of the centre of town at rush hour. Roads are too wide and inefficient to do so.
If you can’t move people into the city centre, what happens is the city centre migrates to where the people are. Jobs disperse around the city along the highway network. Sprawl happens by increments.
Yet some places don’t grow like this. A lot of European cities have suburbs as well as a strong city centre. Jobs and journeys are less dispersed. Heider and Siedentop’s 2020 study compared 65 US and 43 German metro regions over 2003–2015. It found German cities of 2-5 million people were almost twice as concentrated as American ones: 61 per cent of German jobs were in the centre, compared with 34 per cent of American ones.
The following picture is of Munich. Relative to St Louis and Dallas, the centre of Munich is notably broader and denser. And, relative to Dallas or St Louis, there are fewer grey-coloured commercial and industrial zones around the conurbation. Every part of it looks a bit denser.
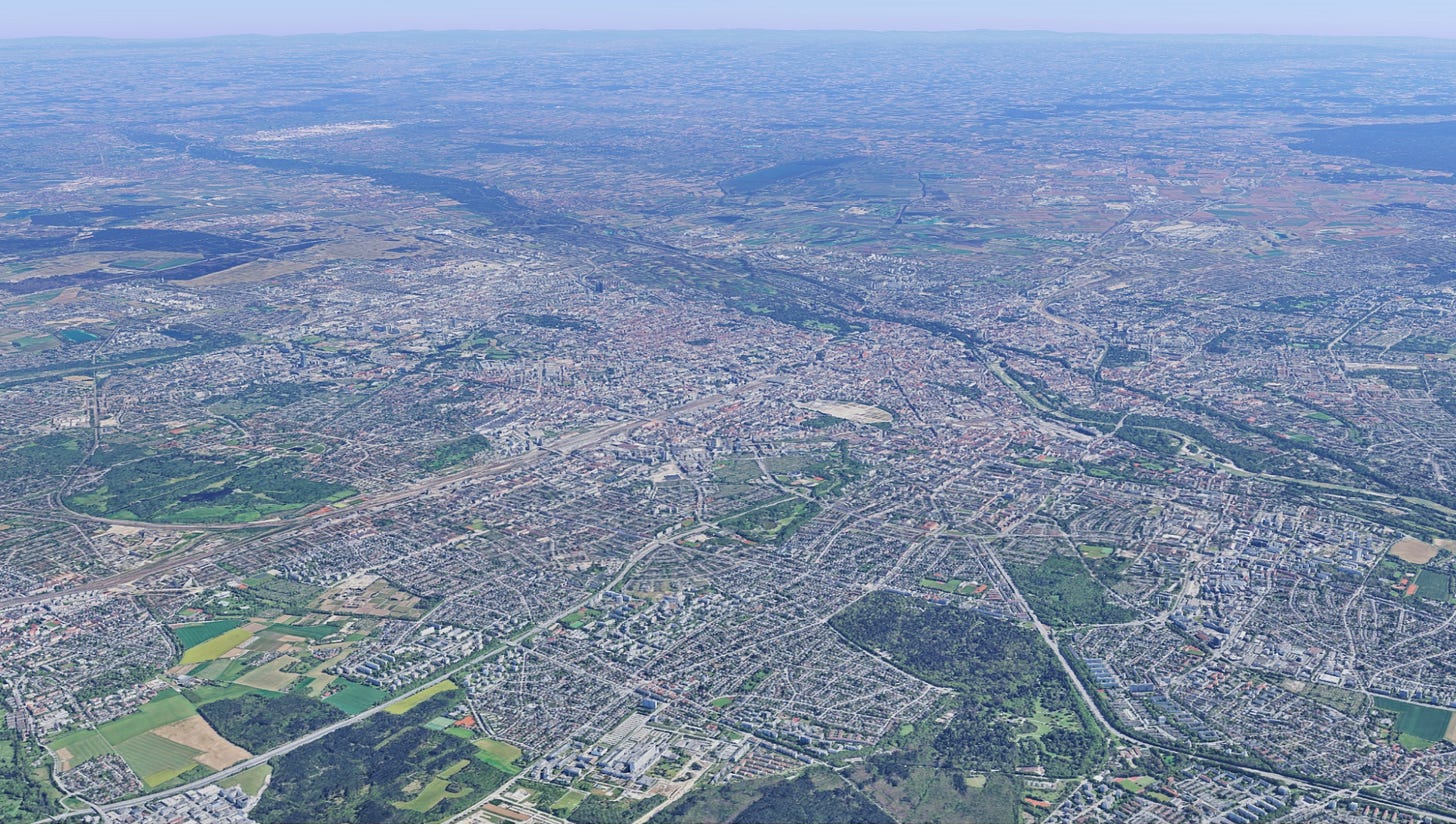
Since Munich is much more centre-focused than its peer city, St Louis, I checked Google Maps for journeys between random points in the conurbation and the centre (rather than between suburbs). The average journey time was 30-35 minutes in rush hour, against 50 minutes in St Louis.
How did Munich and the German cities keep strong centres? We saw roads are too space-inefficient to move big numbers of people into the centre. Rail, however, can do the job. Every German city with a metro population over 2 million has a rail tunnel under its city centre which is used to move commuters in and out. They call these systems S-Bahns (except in Rhine-Ruhr, which uses a different form of rail tunnel).
Where does Dublin stand?
Dublin, as I said, is leveling up. Its population is growing faster than was officially expected. As a result, Dublin’s existing transport strategy is getting a rethink.
The NTA draws up the Greater Dublin Area Transport Strategy; the current one covers 2022 to 2042. Each strategy looks 12 to 20 years ahead, with a review every six years. The next review is happening in 2027.
The process starts with land use. The National Planning Framework (NPF) sets population targets, which are turned into forecasts of people and jobs for each part of the region. The NTA then tests networks in its transport model against those numbers. The totals come down from the NPF.
For the next review, the NTA is changing the first step. Through 2025 it gathered and checked forecasts from all 31 councils in the State, in what it calls the National Forecast Review. Each council now marks the sites where it expects growth, and the NTA updates the data every year. The NTA faults the old method for assuming that growth would keep to the pattern of the base year.
When the NTA conducts its review, a few facts will jump out.
1. Population growth is way ahead of forecast
For population forecasts, the NTA takes its cues from the National Planning Framework. The prior NPF was set out in 2018. It assumed population growth of 0.86 per cent — fast by international standards. However, Dublin has grown much faster than that. Between 2022 and 2026, population growth averaged 1.39 per cent in greater Dublin. The NPF was revised in 2025 to catch up, and now plans for 6.1 million people nationally by 2040, up from 5.8 million. But the NTA’s current strategy was built on the 2018 numbers. Today, the population is about 150,000 greater than was forecast. Based on the current trajectory of population growth, we hit the current 2042 forecast in 2030.
The new NTA strategy will be built on the new NPF, which assumes 1.18 per cent annual growth of Dublin and its suburbs. Significantly faster than the previous estimate, but less fast than the recent trajectory.
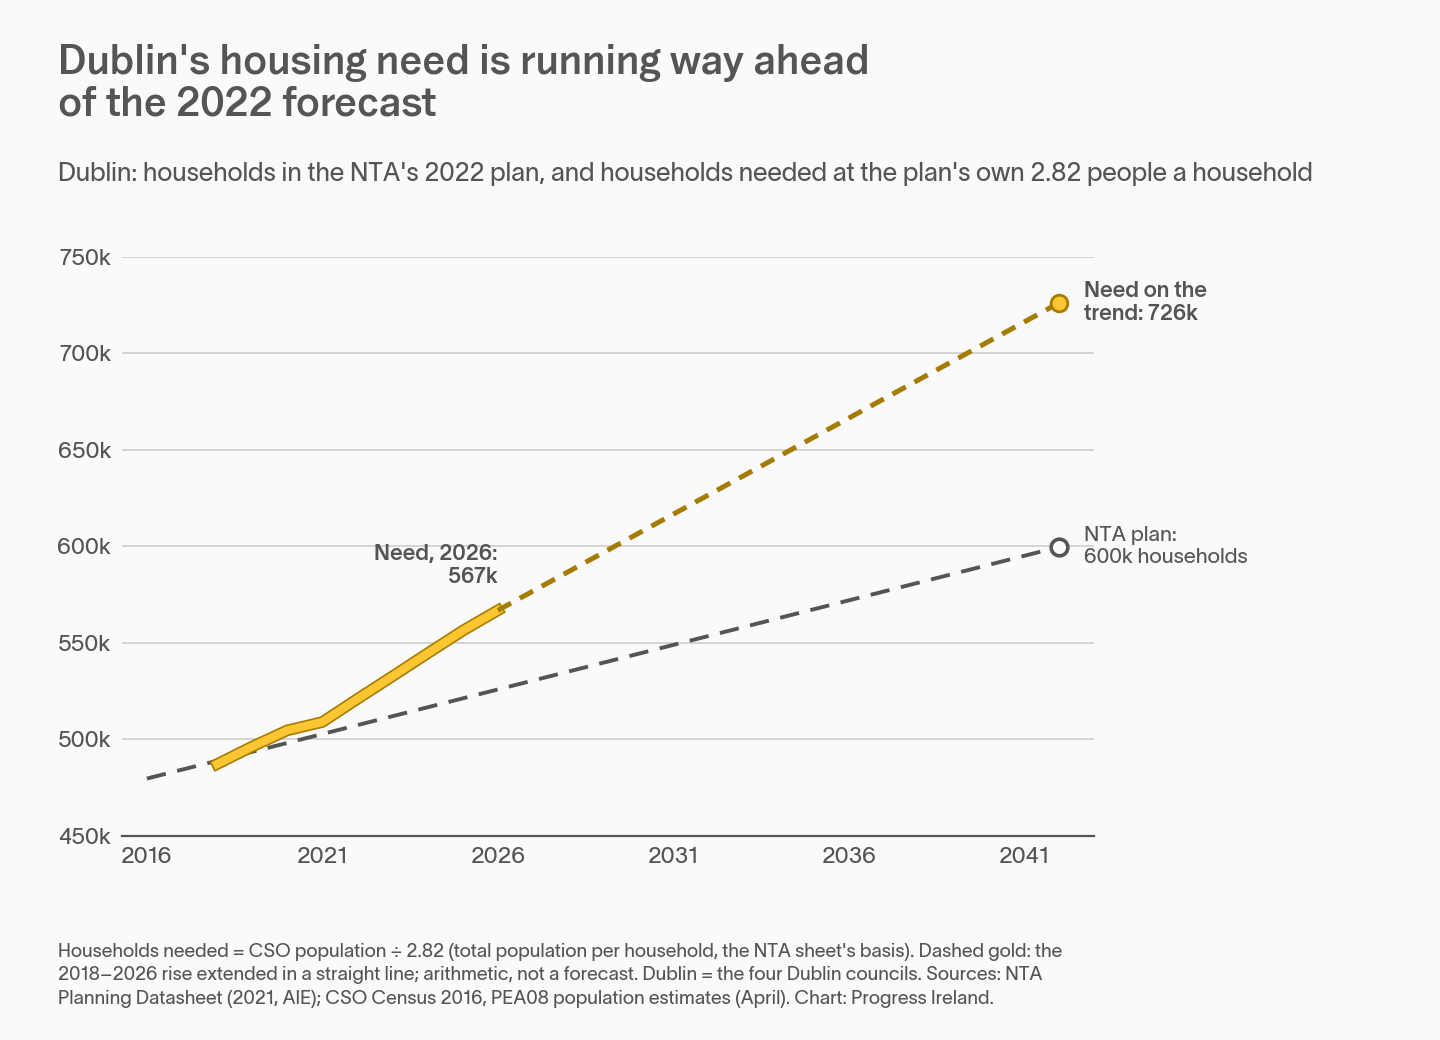
We might be even more short of housing and transport than the official forecast. That’s because the NTA’s model, taking its cues from the National Planning Framework, assumes household size stays the same as it was in 2016. Household size simply refers to the number of people living in each dwelling. The NTA assumes a household size of 2.82; the Housing Commission forecast household size would gradually fall to somewhere between 1.9 and 2.4 by 2050, as the population ages. More homes for the same number of people means more land, and more pressure to build at the edge of the city.
2. The M50 is full
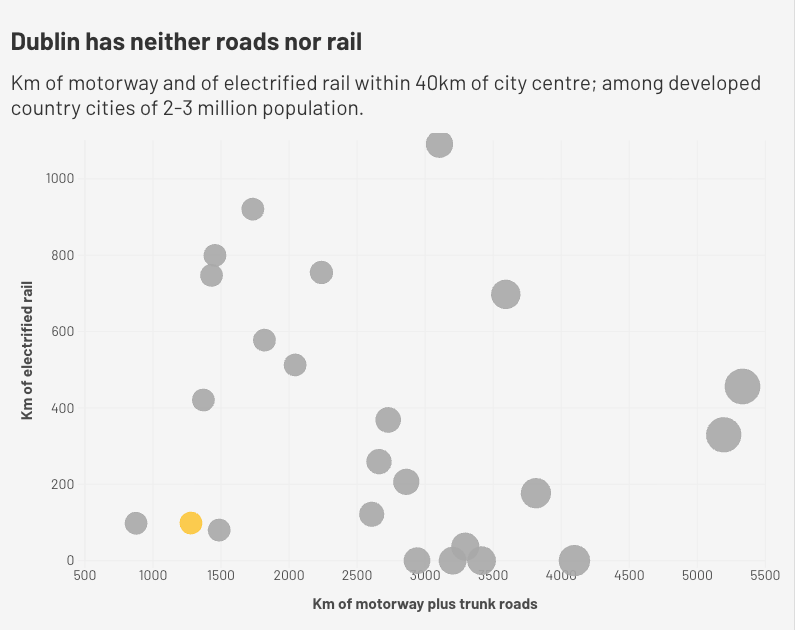
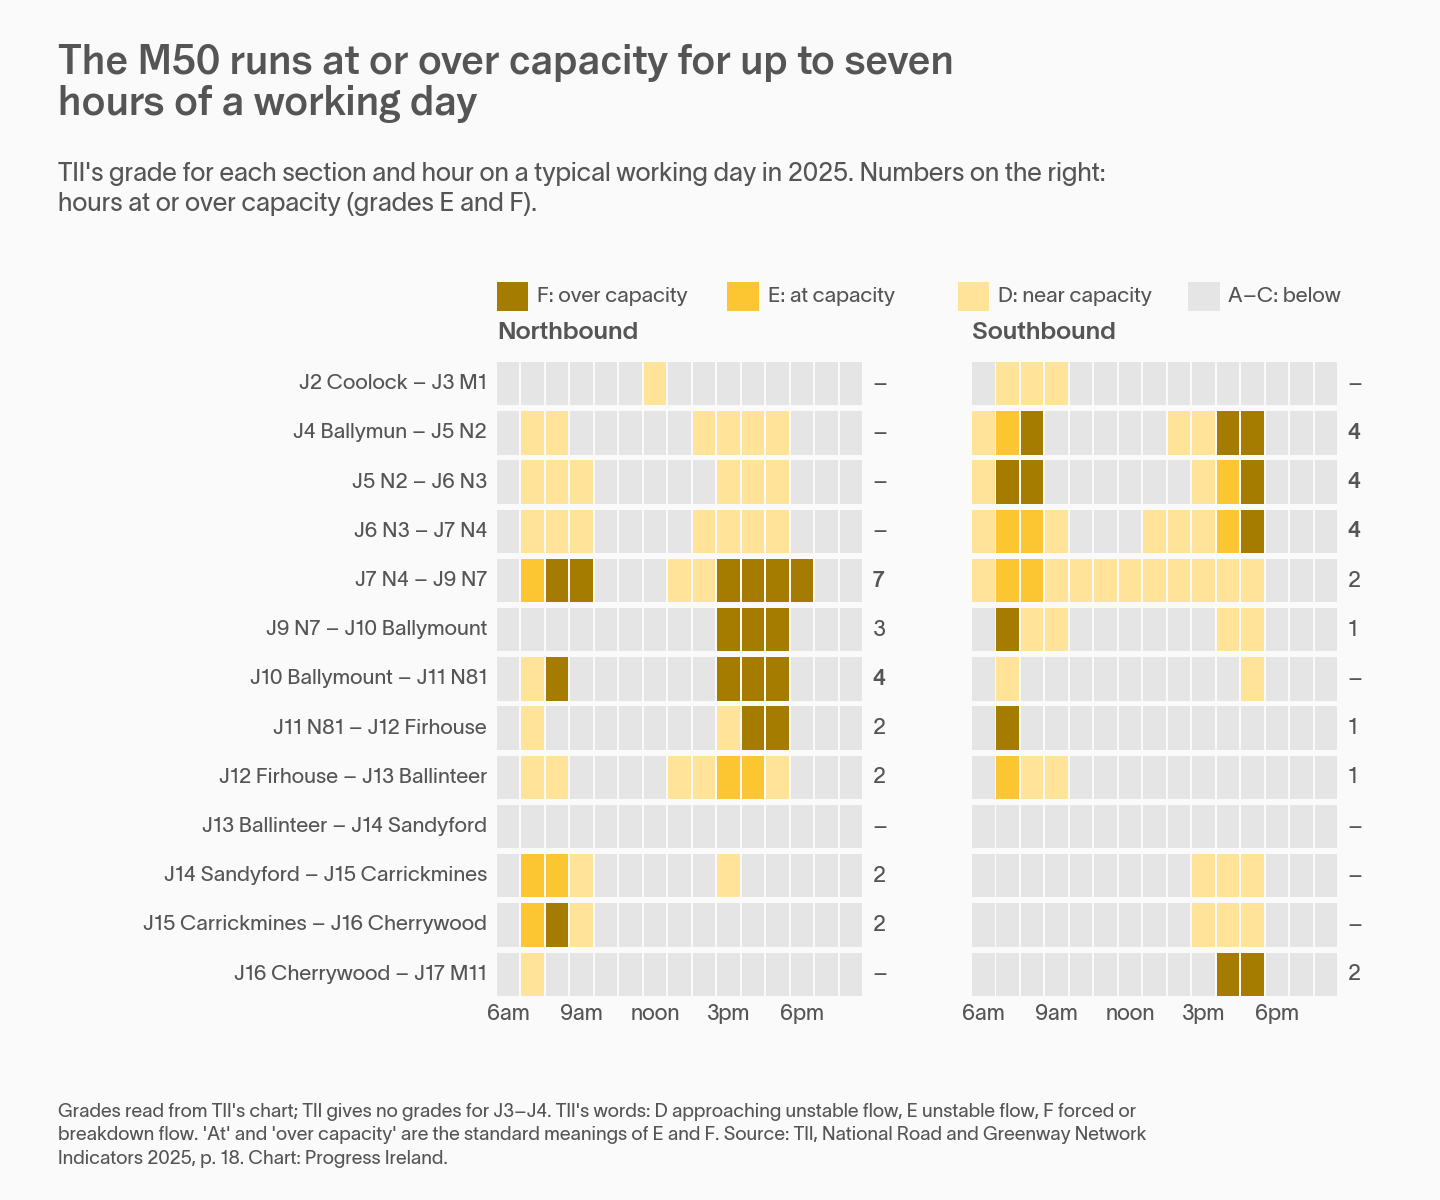
I wrote last week that Dublin has fewer big roads and more congestion than peer cities. The M50 is Dublin’s most important artery. On its worst stretch, between the N4 and the N7, it is at or over capacity for seven hours of a working day. That matters here because the M50 is an orbital road. It doesn’t carry people into the centre; it carries them around it. It is precisely the road a polycentric Dublin would lean on.
3. BusConnects’ capacity is filling up
BusConnects is a thorough rewiring of the bus network to make it bigger and more efficient. It is delivering more journeys already. But its capacity to increase ridership is approaching limits.
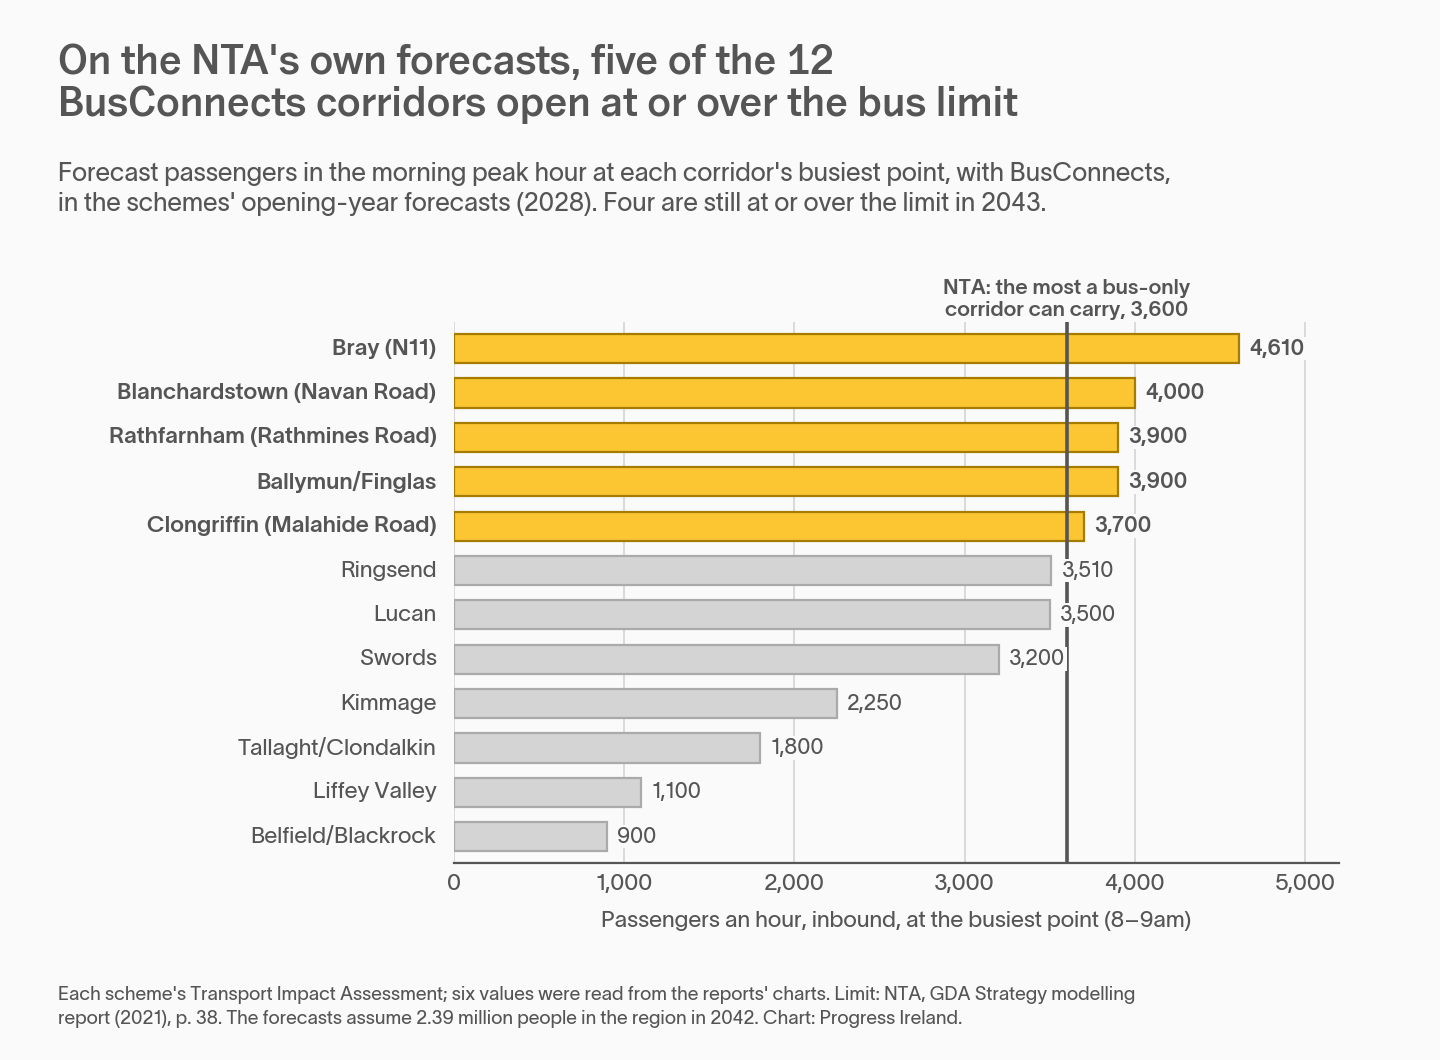
The following chart shows the 12 BusConnects bus corridors. Each bar is the NTA’s forecast of bus passengers travelling into the city at the busiest point at the busiest morning hour, with BusConnects built. The dark line at 3,600 passengers an hour in one direction is the NTA’s own figure for the most a bus-only corridor can carry. The figures come from each scheme’s transport impact assessment for 2028. Above that level, the NTA’s modelling points to light rail. The 3,600 figure is approximate: above that number, more or larger buses can carry more passengers, but at the expense of road space.
4. Dublin is getting less monocentric
What happens to a fast-growing city whose transport access to the centre is reaching capacity? Mechanically, this results in the city getting less monocentric.
As the population of Dublin has grown, the proportion of trips into the centre has declined. The following chart compares trips into the city centre on a midweek rush hour over time. What it is not showing as a week-long average, so it is not depicting a post-covid increase in working from home on Fridays.
The proportion of trips to Dublin’s centre is decreasing. This is normal in a growing city. But then, sprawl is also normal in a growing city. Keeping a strong city centre doesn’t happen by default. It has to be actively chosen and planned for.
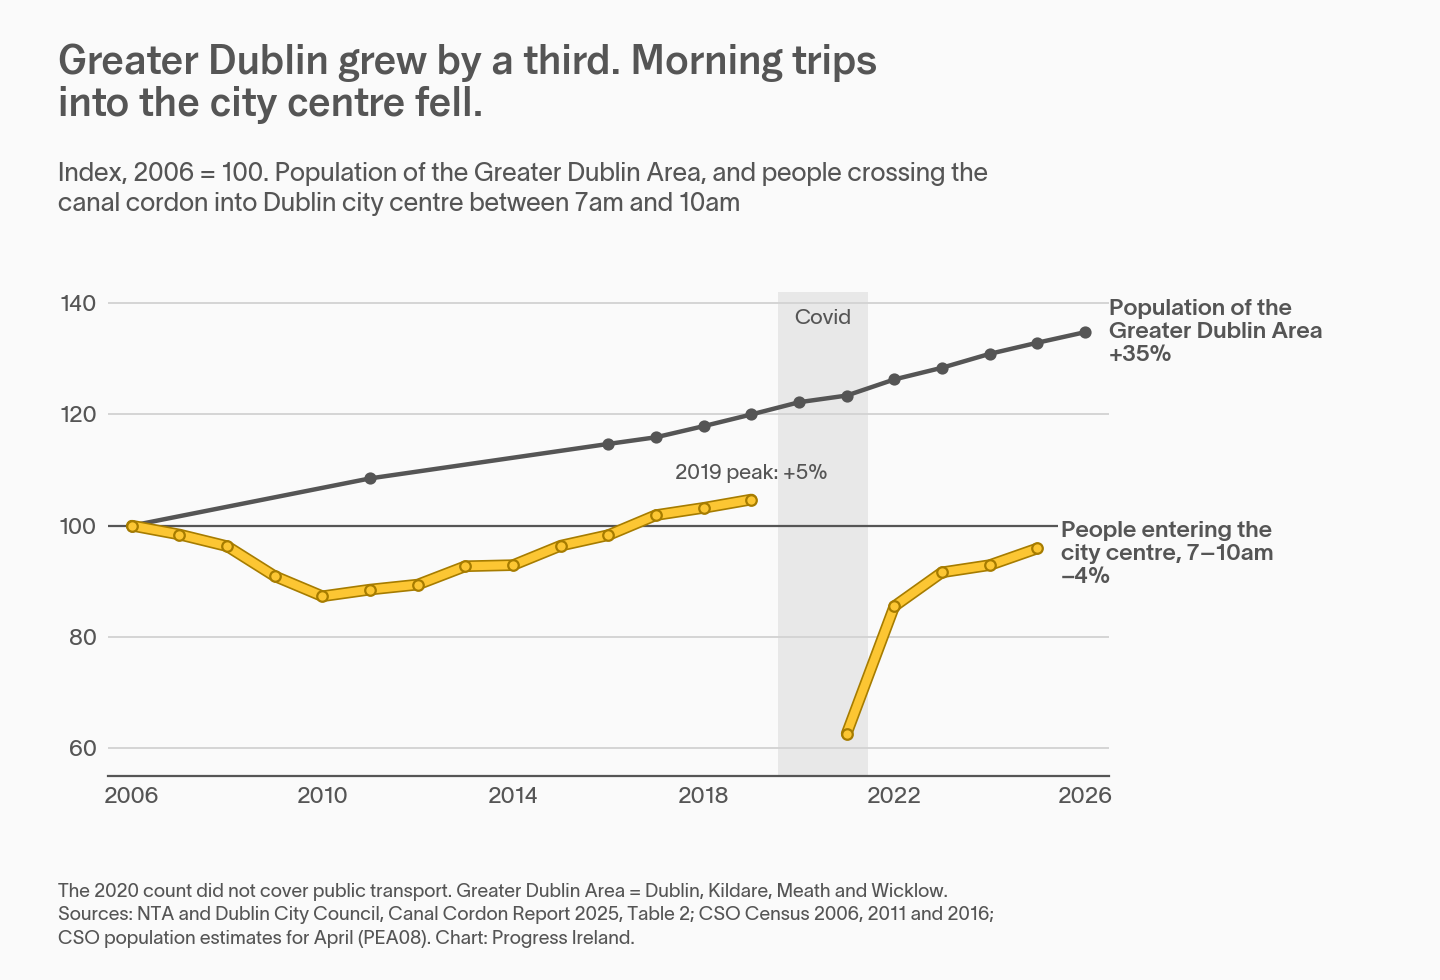
In 2006 a quarter of morning trips in Greater Dublin started or ended in the city centre. Today it is under a fifth2 (disclaimer – this is a tighter definition of the centre than the one used previously, so it doesn’t compare like for like with St Louis etc).
So, to recap: Dublin is growing exceptionally fast. It has fewer trunk roads than its peers. And the ones it has, like the M50, are full at peak. Five of its 12 BusConnects corridors will be at or over their limit in the year they open. And a shrinking share of its trips goes to the centre.
The worst case scenario is the dispersed Dallas pattern, without Dallas’s generous roads. Given that we’re not about to invest in a massive new roads program any time soon, this is a worry.
The German cities show the alternative: a strong centre, unified by suburban rail.
We’ll have more on that in the coming weeks.
1 Planners sometimes use “polycentric” as praise, for a city with several dense, rail-served centres. That isn’t what happens by default. When jobs leave the centre, they don’t tend to regroup into a few new centres. They tend to scatter.
2 One might protest that this a Covid issue. But the numbers compare peak hour midweek trips, which have since recovered after Covid.
Last updated: